Top Artists |
Top Songs |
Top Albums |
About |
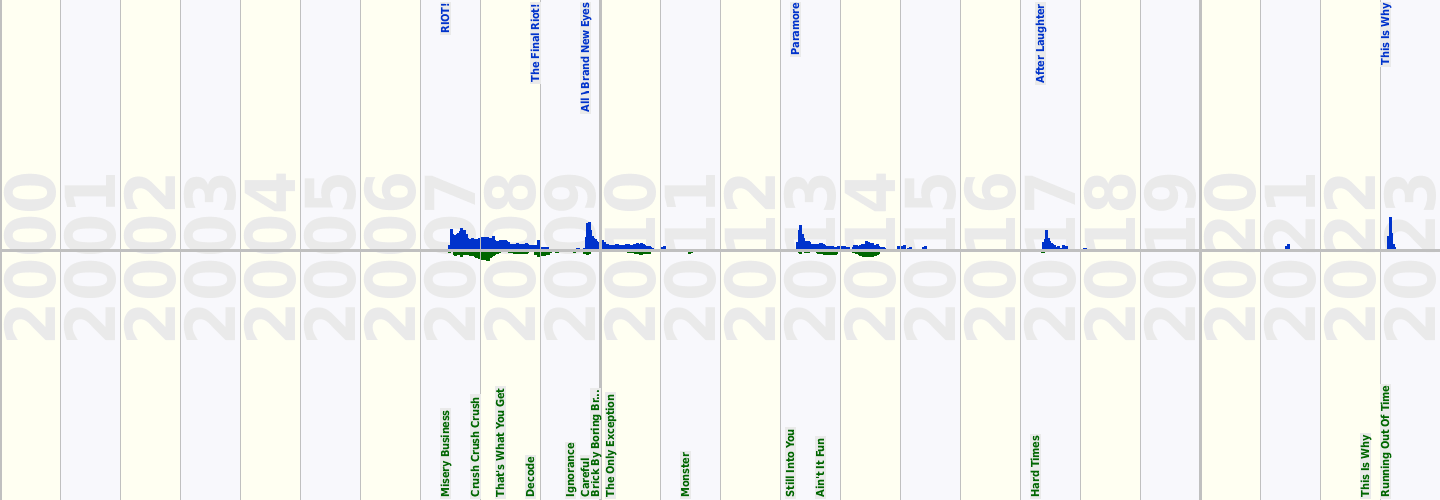
Above is a chart of the success of Paramore for the period (albums above in blue, songs below in green). Read this explantion of the way in which the success plot is generated, also you can download the data for the picture. The rest of this page lists all of the albums and songs by Paramore that became hits between 01 Jan 2000 and 31 Oct 2024. The biggest hits are listed first.
| # | Artist | Album | From | To | Peak Position | Indic Revenue | |||||
| us | uk | de | fr | ca | au | ||||||
| 1 | Paramore | RIOT! | Jun 2007 | Jun 2021 | 15 | 24 | 63 | - | - | 47 | 22961.044 |
| 2 | Paramore | Paramore | Apr 2013 | Jan 2024 | 1 | 1 | 8 | 42 | 3 | 1 | 12127.005 |
| 3 | Paramore | Brand New Eyes | Oct 2009 | Apr 2013 | 2 | 1 | 7 | 36 | 3 | 1 | 11555.036 |
| 4 | Paramore | After Laughter | May 2017 | Feb 2018 | 6 | 4 | 18 | 61 | 9 | 3 | 3618.938 |
| 5 | Paramore | This Is Why | Feb 2023 | Mar 2023 | 2 | 1 | 6 | 107 | 8 | 1 | 2616.871 |
| 6 | Paramore | The Final Riot! | Dec 2008 | Mar 2009 | 88 | - | - | - | - | 38 | 451.636 |
| 7 | Paramore | All We Know Is Falling | Oct 2009 | Jan 2010 | - | 51 | - | - | - | - | 152.100 |
| # | Artist | Song | From | To | Peak Position | Indic Revenue | |||||
| us | uk | de | fr | ca | au | ||||||
| 1 | Paramore | Misery Business | Jun 2007 | Mar 2008 | 26 | 17 | 79 | - | - | - | 5256.225 |
| 2 | Paramore | Ain't It Fun | Sep 2013 | Aug 2014 | 10 | - | - | - | 27 | 32 | 3525.362 |
| 3 | Paramore | Decode | Nov 2008 | Dec 2009 | 33 | 52 | 47 | 10 | 48 | 12 | 3186.080 |
| 4 | Paramore | Still Into You | Mar 2013 | Dec 2013 | 24 | 15 | - | 189 | - | 5 | 2835.003 |
| 5 | Paramore | The Only Exception | Mar 2010 | Sep 2011 | 24 | 31 | - | - | 25 | 17 | 2103.795 |
| 6 | Paramore | That's What You Get | May 2008 | Oct 2008 | 66 | 55 | - | - | - | - | 1723.584 |
| 7 | Paramore | Crush Crush Crush | Dec 2007 | Apr 2008 | 54 | 61 | - | - | - | - | 1655.616 |
| 8 | Paramore | Ignorance | Jul 2009 | Nov 2009 | 67 | 14 | 42 | - | - | 35 | 589.082 |
| 9 | Paramore | Hard Times | Apr 2017 | Jun 2017 | 90 | 34 | - | - | 65 | - | 333.641 |
| 10 | Paramore | Monster | Jun 2011 | Aug 2011 | 36 | 21 | - | - | - | - | 299.464 |
| 11 | Paramore | This Is Why | Oct 2022 | Feb 2023 | - | 61 | - | - | - | - | 86.008 |
| 12 | Paramore | Now | Mar 2013 | Apr 2013 | - | 39 | - | - | - | - | 78.618 |
| 13 | Paramore | Careful | Oct 2009 | Oct 2009 | 78 | - | - | - | - | - | 68.866 |
| 14 | Paramore | Brick By Boring Brick | Dec 2009 | Jan 2010 | - | 85 | - | - | - | - | 51.632 |
| 15 | Paramore | Running Out Of Time | Feb 2023 | Feb 2023 | - | 74 | - | - | - | - | 33.330 |